
How Well Do You Know Your Usage? Half-Hourly Data Is Your Energy Fingerprint
Your half-hourly data tells a stranger more about your business than your accounts do.
A half-hourly meter takes 48 readings a day. That is 17,520 a year. Each one is a number and a timestamp. No name, no address, no job title. Yet from the shape alone, a stranger works out when you open, what runs overnight, whether a compressor is failing and whether someone left the heating on over Christmas.
Telnergy has worked with thousands of UK businesses since 2002 and manages 600 on a two-year renewal cycle. In that time I have learned to read a load profile before I read the bill that goes with it.
Half-hourly data is an energy fingerprint, and most businesses have never looked at their own.
Twelve businesses, twelve fingerprints
The twelve profiles below are synthetic. I built them to show shape, not to describe any client. Every business type has a signature, and each one gives itself away in a different place.
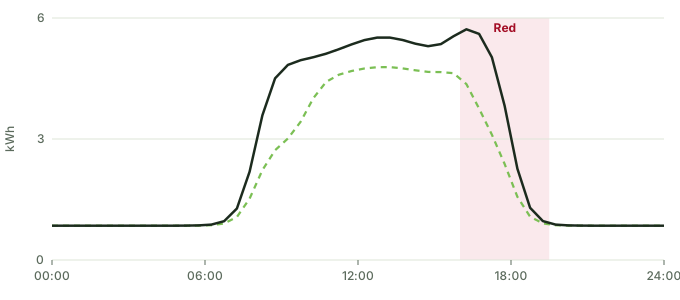
Read each chart the same way. The solid line is a typical weekday and the dashed line a typical weekend. The shaded block is the Red band from the Northern Powergrid Yorkshire charging statement for 2026-27: weekdays, 16:00 to 19:30. Other regions set different times.
How to read the charts: solid dark line = typical weekday · dashed green line = typical weekend · shaded block = Red band, Monday to Friday 16:00 to 19:30 · figures are kWh per half hour.
01. Evening restaurant
Kitchen, extraction, cold room
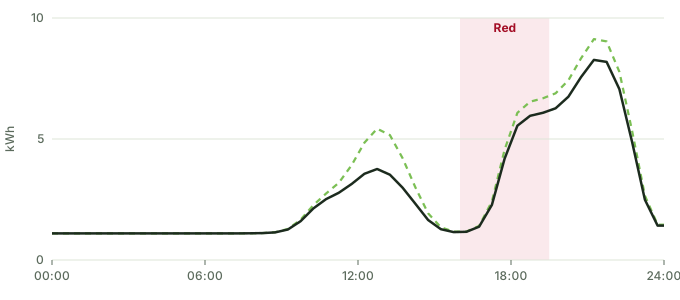
Weekday: 133 kWh · Base load: 2.2 kW · Red band share: 20%
- The floor of roughly 2 kW overnight is refrigeration. Nothing else is running.
- Prep starts around 10:00, service ramps at 17:30 and the extraction stays on until close.
- Dinner service starts inside the Red band, so the first part of the peak pays the dearest distribution rate.
02. Small office
Lighting, IT, heating and cooling
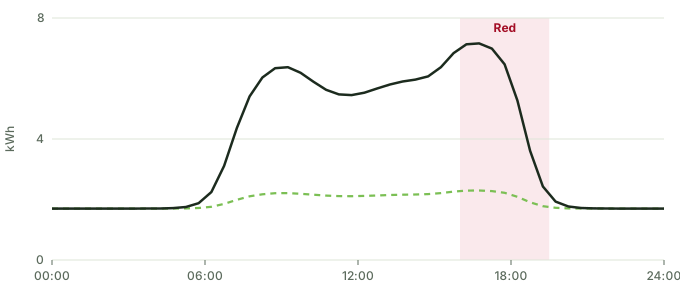
Weekday: 186 kWh · Base load: 3.4 kW · Red band share: 21%
- Weekday load starts at 07:00, so the heating or cooling is on a timer, not a person.
- A floor of about 3.5 kW at 03:00 points to servers, a comms cabinet or a forgotten standby load.
- Saturday and Sunday still reach about half of a weekday total. A closed office should sit lower.
03. Bakery
Ovens, provers, chillers
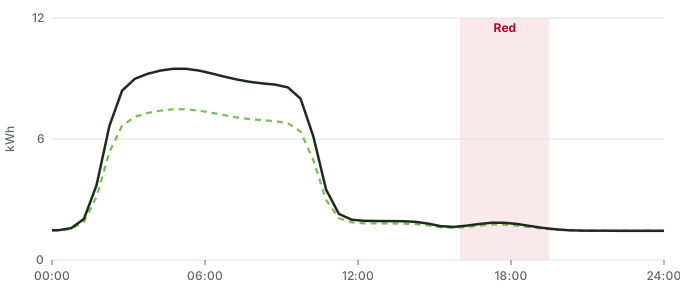
Weekday: 204 kWh · Base load: 2.9 kW · Red band share: 6%
- Load climbs at 02:00. The ovens go on while the street sleeps.
- By 10:30 the peak is over and the site drops to chillers and lights.
- Almost nothing lands in the Red band. This site makes its money on Green and Amber units.
04. Care home
Kitchen, laundry, 24 hour lighting
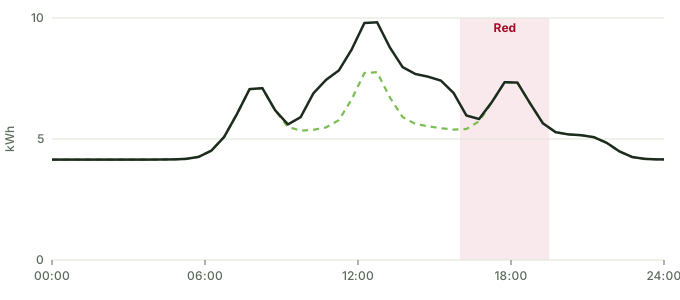
Weekday: 282 kWh · Base load: 8.3 kW · Red band share: 16%
- Weekday and weekend look alike. Residents do not take weekends off.
- A laundry block between 10:00 and 16:00 on weekdays adds about 2 kWh per half hour.
- Meal service marks the day at 08:00, 12:30 and 18:00. A flat base of about 8 kW sits underneath.
05. Cold store
Compressors and defrost cycles
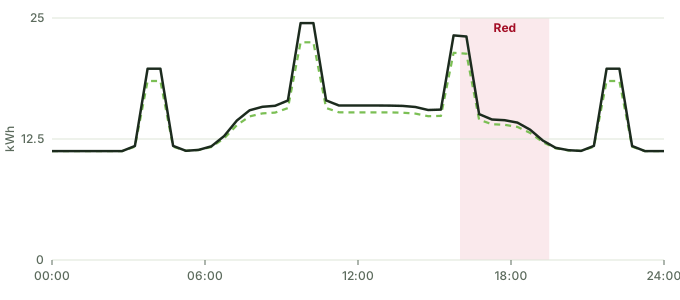
Weekday: 714 kWh · Base load: 22.5 kW · Red band share: 15%
- Compressor load never drops below about 22 kW. This is a continuous process.
- Spikes every six hours at 04:00, 10:00, 16:00 and 22:00 are defrost cycles, set on a timer.
- The 16:00 defrost lands at the start of the Red band. Moving it out is a timer setting.
06. High street shop
Lighting, display, air conditioning
Weekday: 130 kWh · Base load: 1.7 kW · Red band share: 19%
- Load starts rising at 08:00, an hour before the doors open. A trading-hours timer takes that hour back.
- Saturday trades a full day. Sunday opens late and closes early.
- The overnight floor of about 1.7 kW is signage and security. Both are worth a second look.
07. Primary school
Heating, kitchen, IT
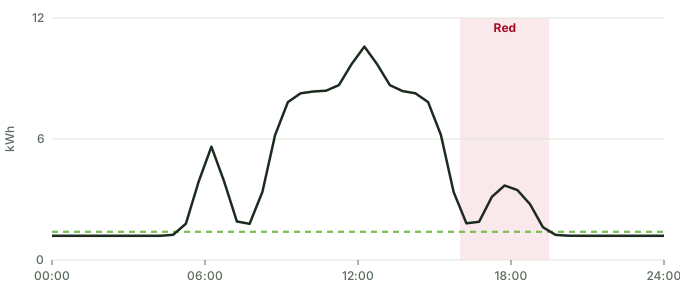
Weekday: 184 kWh · Base load: 2.4 kW · Red band share: 10%
- Boiler pre-heat at 06:00, school day at 08:30, cleaners from 17:00.
- Weekends fall to a flat 2.8 kW. Holiday weeks should show the same floor.
- Little falls in the Red band. School load is a daytime Amber profile.
08. Hotel
Rooms, kitchen, laundry, lifts
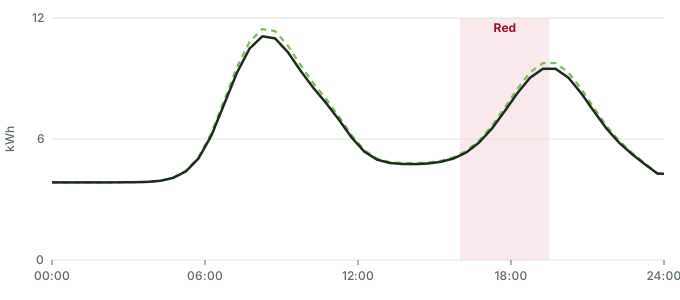
Weekday: 305 kWh · Base load: 7.7 kW · Red band share: 17%
- Two humps tell the story. Breakfast and checkout, then dinner and evening room use.
- A floor of about 8 kW overnight is corridors, lifts, fridges and rooms on standby.
- The evening hump starts inside the Red band.
09. Warehouse with EV fleet
Forklifts, lighting, van charging
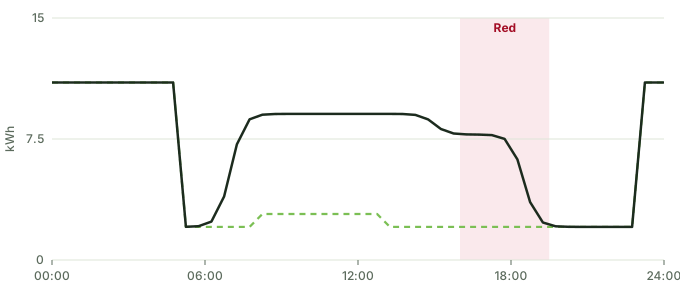
Weekday: 358 kWh · Base load: 4.1 kW · Red band share: 12%
- A flat block of 11 kWh per half hour from 23:00 to 05:00 is van charging, every night including weekends.
- The daytime shape is forklifts and lighting from 07:00 to 18:30.
- The block sits in Green, the cheapest band. If the timer drifts to 16:00, the same load lands in Red.
10. Dental surgery
Compressors, steriliser, lighting
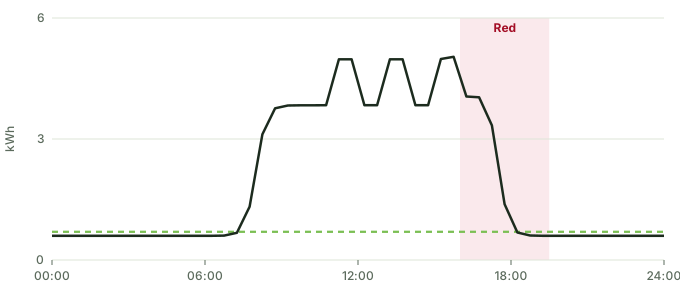
Weekday: 98 kWh · Base load: 1.2 kW · Red band share: 15%
- Surgery hours show clearly. Nothing before 08:00, nothing after 17:30.
- Short spikes at 11:30, 13:30 and 15:30 are steriliser cycles.
- Weekend load of about 1.4 kW is the compressor and a fridge. A flat floor means nothing is misbehaving.
11. Neighbourhood pub
Cellar cooling, kitchen, lighting
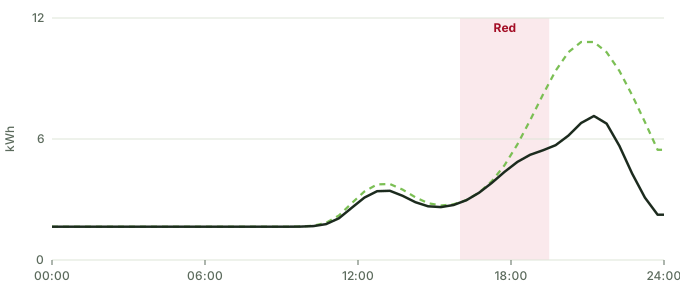
Weekday: 143 kWh · Base load: 3.3 kW · Red band share: 21%
- Cellar cooling holds a floor of about 3.5 kW all night.
- Weekend evenings run about 55% above a weekday evening. The dashed line shows it.
- Weekday evening trade starts inside the Red band. The weekend peak sits mostly after it ends.
12. Factory with rooftop solar
Machinery, compressed air, 25 kWp solar
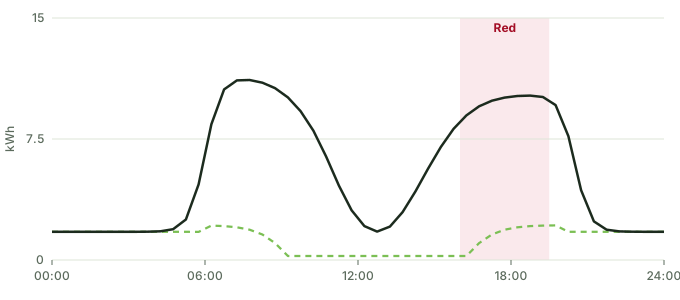
Weekday: 265 kWh · Base load: 3.5 kW · Red band share: 26%
- Midday dip in the weekday shape is solar. Import falls even while machines run at full output.
- The size of the dip gives the array away. About 9 to 10 kWh per half hour is close to 19 kW at peak, so an array near 25 kWp.
- Solar output falls away through the Red band, so the site imports its dearest units at close to full load.
Three numbers describe most of the fingerprint
Base load is what you pay for when nobody is working. Take the lowest half-hour reading in the night and double it. That is your base load in kW. The small office above holds about 3.5 kW at 03:00 with the doors locked. Over a year that is roughly 30,000 kWh for nothing, and it is usually the easiest saving in the building.
The shape tells a stranger your opening hours. The dental surgery switches on at 08:00 and off at 17:30. The bakery wakes at 02:00. The pub gives itself away every Friday. Anyone holding your data knows your trading pattern, your shift changes and your quiet weeks.
Red band share decides how much of your network charge you control. Red units carry the highest distribution rate in your region. In the twelve profiles, the Red share of weekday kWh runs from 6% for the bakery to 26% for the solar factory. Two sites of the same size pay very different network charges because of where their load falls.
Your supplier prices the shape while you see the total
A supplier does not quote you an annual kWh figure. A pricing desk quotes your shape. A flat load is usually cheaper to hedge than a spiky one, and a load that peaks at 17:00 costs more to cover than one that peaks at 11:00. You see one unit rate and a monthly total. They see 48 readings a day.
The shape changes between contract and renewal, and nobody tells the pricing desk. You add a cold room, a charger, a second shift or a solar array. The contract still reflects the old fingerprint. At renewal the market reprices you on the new one.
Most quotes start from annual consumption, and the shape is where the difference sits. Two businesses on 200,000 kWh a year hold very different risk. At Telnergy we look at the shape first and the price second, because the shape explains the price.
Five checks to run on your own data this week
- Get twelve months of half-hourly data from your supplier or meter operator.
- Find the lowest overnight reading, double it, and ask what is running.
- Put a typical Tuesday next to a typical Sunday. If Sunday looks like Tuesday, something runs that should not.
- Add up your weekday kWh between 16:00 and 19:30 and divide by the daily total. That is your Red share for Yorkshire. Use your own region’s times if you sit elsewhere.
- Look for a spike at the same time every day or week. Defrost cycles, immersion heaters and chargers all leave one. Fix it or move it.
The bigger question is who owns the fingerprint
With a smart meter at home, the householder decides how much detail the supplier sees. Half-hourly readings reveal when people are in, asleep or away, so the rules treat them as personal data.
Businesses on half-hourly settlement do not get that dial. Your supplier holds your readings. So does your data collector, your network operator and, once you sign a letter of authority, your consultant. Each copy tells the holder how your business runs.
Treat your half-hourly data as you treat your management accounts. Know who holds it. Sign a letter of authority only for a named purpose and a named period. Ask what happens to the data when the contract ends. Most businesses never ask, and the data keeps working for other people long after the relationship stops.
The practical question is what your shape costs you
If a stranger posted your fingerprint through the door tomorrow, would you recognise it? Could you say what the 03:00 floor is, why Sunday sits where it does, and how much of your week lands in Red?
Every answer you cannot give is a cost someone else already priced in.
Your meter already tells the story of your business.
The only open question is who reads it first.
Make it you.
Johnny Arthur, Director, Telnergy Ltd. Independent energy consultants.
Telnergy Limited is an independent commercial energy consultancy established in 2002, based in Christchurch, Dorset. Ofgem-aligned consultancy · ADR Ref E3561 · CRN 04576876.